Charging Business
What Goes Into the Cost of an EV Charging Station: The Full Cost Structure
The full cost structure of an EV charging station: hardware, grid connection, civil and electrical works, software, soft costs and running costs.
- Prepared by
- VULTAE Engineering Team
- Published
- Reading time
- 5 min
- Sources
- 3 references
Key takeaways
- 1The charger is only one line of the cost. ICCT’s US cost study put hardware at roughly a quarter of total charging infrastructure cost, with labour about half, materials a fifth and permits around 5 %.
- 2For DC sites, the grid connection — transformer, switchgear, cables and utility fees — is usually the largest and least predictable item after the chargers, and the one with the longest lead time.
- 3Installation cost per charger falls as more chargers share a site: one trench, one transformer and one permit serve several units. Plan for the final number of chargers even if you build in phases.
- 4Running costs matter as much as capital: energy, demand charges, software, payment fees and maintenance. At low utilization, demand charges can be most of the electricity bill.
Contents
Short answer: an EV charging station costs much more than its chargers. In the ICCT’s US study, hardware was roughly a quarter of total charging infrastructure cost; labour was about half, materials about a fifth and permits around 5 %. For DC sites the grid connection is the other big item, and installation cost per charger falls as more chargers share a site. Budget the running costs too — at low utilization, demand charges can dominate the electricity bill.
The cost stack at a glance
The exact split differs by charger type and site — AC wallboxes on an existing wall are mostly labour; a new DC hub with its own transformer is dominated by hardware and grid works — but the lesson holds everywhere: quote the whole project, not the charger.
Capital costs, line by line
| Line | What it includes | What drives it |
|---|---|---|
| Charging hardware | Chargers, pedestals or stands, cables, payment terminals, screens | Power, connectors, options, quantity — see comparing quotations |
| Freight and import | Packing, sea freight, insurance, duties, clearance | Incoterm, destination, HS code — see shipping from China |
| Grid connection | Utility connection fee, transformer, switchgear, metering | Spare capacity at the site, distance to the network, utility rules |
| Electrical installation | Cables, distribution boards, protection, earthing, load-management controller | Cable length and size, number of chargers |
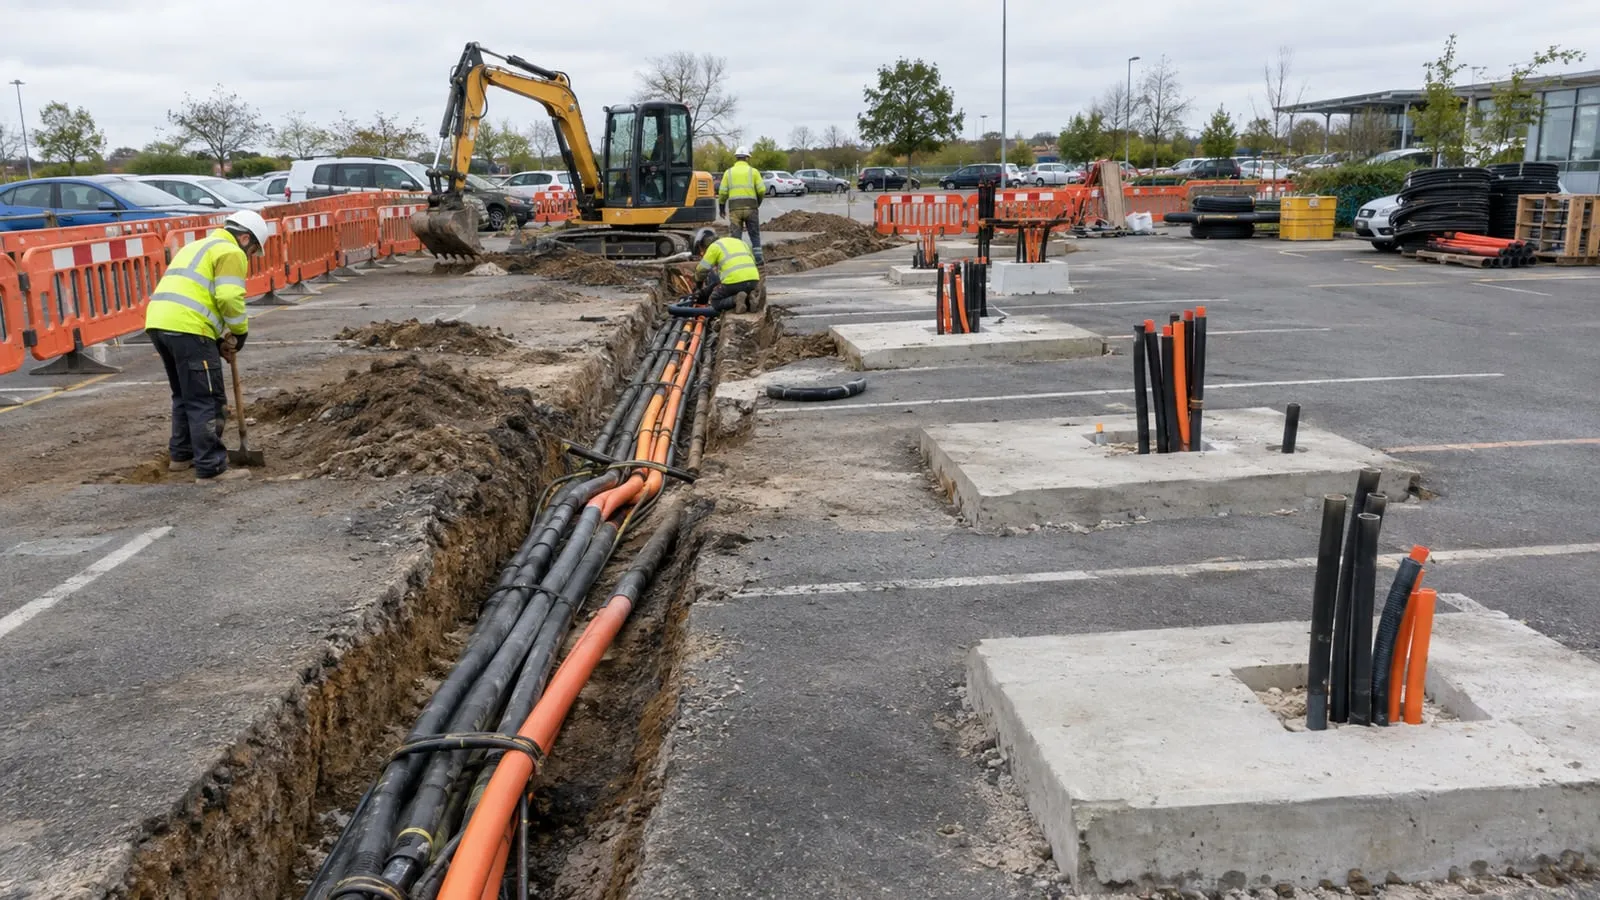
| Civil works | Trenching, ducts, foundations, bollards, kerbs, surfacing, canopies | Ground conditions, distances, site layout |
| Signage and markings | Bay markings, signs, accessible bays | Local rules |
| Software set-up | Back-end onboarding, payment set-up, integration | Platform choice |
| Soft costs | Site survey, design, permits, project management, commissioning | Local permitting, project size |
| Contingency | 10–15 % of the above | Unknowns underground and in the grid |
Hardware is the easy part to compare
Hardware prices are visible and easy to compare between suppliers. The rest is where projects run over budget: an unexpected transformer upgrade, rock under the car park, or a permit that requires extra fire separation. A site survey before ordering — supply capacity, cable routes, ground — is the cheapest insurance.
Grid connection: the item with the longest lead time
| Site | Typical grid work |
|---|---|
| A few AC chargers in an existing car park | Spare capacity on the existing supply; new sub-board |
| Many AC chargers in a building | Load management; sometimes a supply upgrade |
| One or two DC chargers | Larger low-voltage connection or a small transformer |
| DC hub | Medium-voltage connection, dedicated transformer, switchgear |
Utilities often need months to quote and build a new connection. See grid power for DC fast-charging sites.
Economies of scale
The ICCT found that installation cost per charger falls as more chargers are installed at one site: one trench, one transformer, one design and one permit are shared. Two practical rules follow:
- Cluster chargers rather than spreading single units across many sites, unless coverage is the goal.
- Build for the final layout: in the first phase, install ducts, cable routes and a supply sized for later chargers. Digging twice costs far more than slightly oversizing once.
Running costs
| Line | Fixed or variable | Notes |
|---|---|---|
| Energy | Variable | Price per kWh; time-of-use periods |
| Demand and standing charges | Mostly fixed | Set by the highest power drawn; see demand charges |
| Back-end software and SIM data | Fixed per charger | Monthly fee per port is common |
| Payment processing, roaming | Variable | Percentage or per transaction |
| Maintenance and repairs | Fixed contract + variable | Preventive visits, spare parts — see the spare-parts list |
| Site lease or revenue share | Fixed or variable | Agreed with the landowner |
| Insurance, support, cleaning | Fixed |
Demand charges deserve special attention. RMI’s study of DC fast-charging tariffs found that at low utilization they can make up the large majority of a monthly electricity bill, pushing the effective energy cost far above the average tariff. Your utility’s tariff structure can matter as much as the charger price.
Reduce cost without cutting corners
| Measure | Saves |
|---|---|
| Choose sites with spare electrical capacity close to the bays | Grid and cable cost |
| Dual-connector DC and dual-port AC units | Fewer foundations, trenches and supply points |
| Compact cabinets where space is tight | Civil works |
| Load management | Smaller connection, lower demand charges |
| Standard configurations rather than one-off variants | Hardware and certification cost |
| Modular DC chargers with remote diagnostics | Repair cost and downtime |
| Ducts for future bays in phase 1 | A second round of civil works |
Turning costs into a decision
Once you have every line, put them into a business case: fixed annual costs, margin per kWh and the utilization you need to break even. The method is in is an EV charging station profitable?, and a full planning template in EV charging station business plan.
Questions buyers ask
- What is the biggest cost in an EV charging station?
- For AC chargers, installation — labour, cables and protection — often costs more than the charger. For DC sites, the charger hardware and the grid connection (transformer, switchgear, utility works) are the two largest items, followed by civil works.
- Why does installation cost vary so much between sites?
- Distance from the electrical supply, whether the existing transformer has spare capacity, ground conditions for trenching, local labour rates, permit requirements and how many chargers share the work all change the cost. Two identical chargers can have very different installed costs.
- Is it cheaper to install several chargers at once?
- Yes, per charger. The ICCT found installation cost per charger falls as more chargers are installed at a site, because trenching, the transformer, design and permits are shared. If you build in phases, install ducts and size the supply for later chargers in the first phase.
- What running costs should I budget?
- Energy and demand charges, back-end software and SIM data, payment processing and roaming fees, maintenance and repairs, site lease or revenue share, insurance and customer support.
References
- [1]Estimating electric vehicle charging infrastructure costs across major U.S. metropolitan areas. International Council on Clean Transportation (ICCT).
- [2]DCFC rate design study. RMI.
- [3]Alternative Fuels Data Center — developing infrastructure to charge electric vehicles. U.S. Department of Energy.